Tag Archives: Species distribution

Uphill (and downhill!)

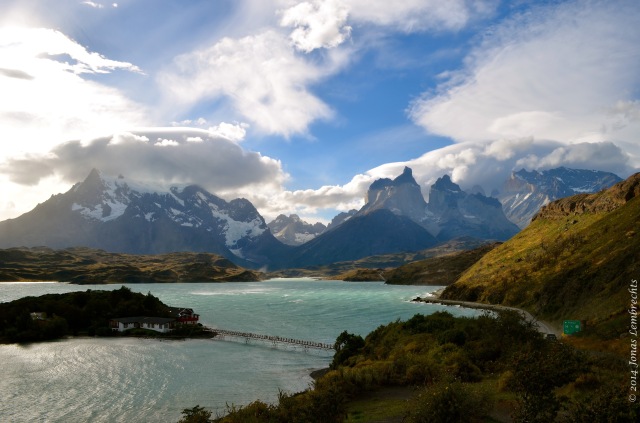
Torres del Paine

Our climate is changing, that much is clear. The main effect of this changing climate is that what once was balancing now starts shifting. As if our little world became a plate full of beer pulls, losing its balance on the shaking hands of an inexperienced innkeeper. One of the most obvious effects of climate change on plant and animal life is visualised in the shifting geographical ranges of many  species.

Scientists have been hunting for these range shifts for years, resulting in a growing pile of scientific papers on the matter. Case after case, the hypothesis is clear: the climate is warming, so species will follow the track of these increasing temperatures: uphill and to higher latitudes, towards the arctic and alpine world. Indeed, more and more longterm experiments and observations bring exactly those patterns to light. These results are accompanied by the worrying message that the original inhabitants species of the invaded cold environments themselves don’t have anywhere to go.

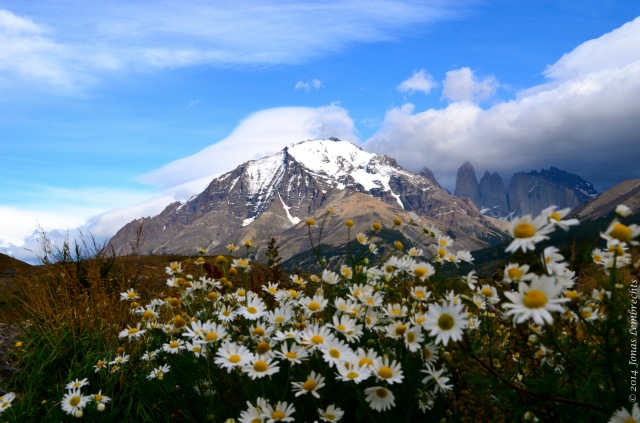
Invasive plants like this chamomile in the Chilean Andes hike surprisingly fast uphill.

As the proof of this invasion of heat-loving species adds up and the risk for the alpine and arctic vegetation becomes more apparent, it is easy to forget that some species might act opposite of our expectations. An important amount of species indeed seems to hurry uphill, but an as important (albeit smaller) group in the meantime moves downwards, against all odds.

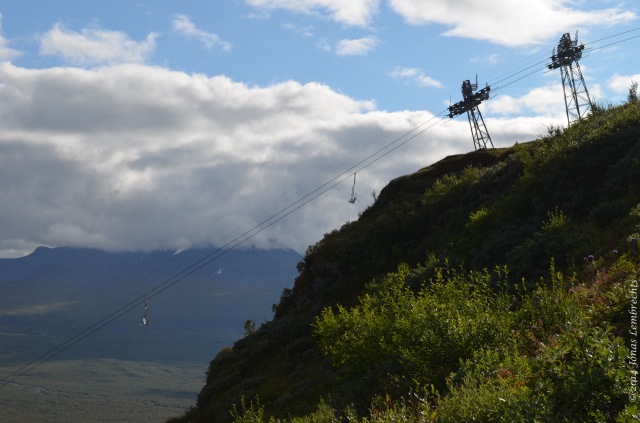
On a steep slope, going downhill might just be a lot easier than going up.

For years, this lasts group has been pushed aside as a mere statistical side effect, nothing more than noise on the data, the inevitable variance around a positive average. Concluding as such however ignores the importance of this group of species. Climate change includes more effects than only this warming trend. Not only temperatures change, but the climatic water balance undergoes drastic alterations as well. In several dry areas, precipitation patterns might even be more influential than the warming effect. In that case, those changing precipitation levels can unexpectedly push species downhill, in a hunt for similar climatic conditions.

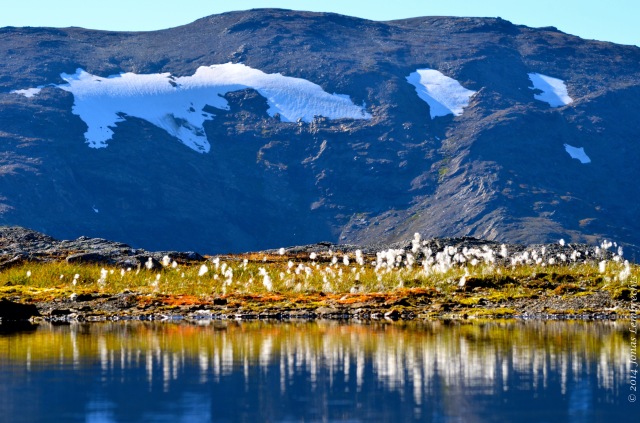
In the mountains, water often plays an as important role as temperature.

There are alternative explanations for these patterns as well. A lot of species are for example not limited by the climate at the warm side of their distribution. They only taste defeat due to competition with faster growing species. As a result of the changing climate, however, those competitive dominances start shifting, which creates new opportunities at these lower range edges.

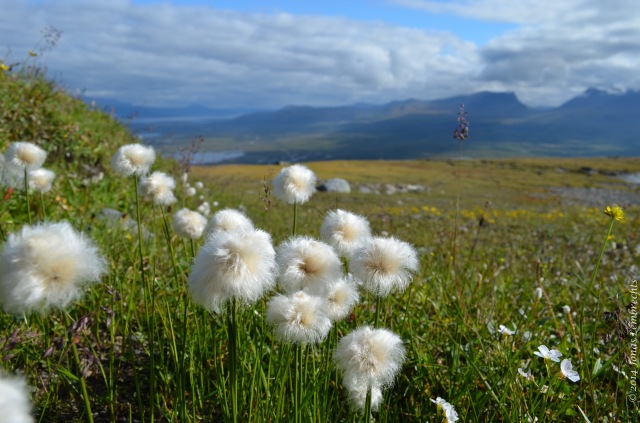
Many mountain plants have a large dispersal potential, as they can rely on the omnipresent winds.

Bottom-line is that most effects in ecology might and will be in different directions at once. As a scientist, it is important to keep this in mind and give the unexpected minority the attention it deserves. I stumbled on this story when I was looking at the expected distribution shifts of invasive species in the mountains. The lesson is clear: better not forget to look downhill once!

DSC_0382

I hope to bring you more on that matter as soon as some more stories make it through the review process. Until then, all the cool action is going on here!

Two relevant reads:

Crimmins, S. M., Dobrowski, S. Z., Greenberg, J. A., Abatzoglou, J. T. & Mynsberge, A. R. (2011) Changes in Climatic Water Balance Drive Downhill Shifts in Plant Species’ Optimum Elevations. Science, 331, 324-327. (here)

Lenoir, J., Gegout, J.-C., Guisan, A., Vittoz, P., Wohlgemuth, T., Zimmermann, N. E., Dullinger, S., Pauli, H., Willner, W. & Svenning, J.-C. (2010) Going against the flow: potential mechanisms for unexpected downslope range shifts in a warming climate. Ecography, 33, 295-303. (here)

January 22, 2015
This biodiversity researcher used Flickr for data, and you won’t BELIEVE what happened next!

Jewel Eyed Beetle

Is this a datum? Jewel Eyed Beetle (what kind? I don’t know! I’m a marine biologist not an entymologist!) near Corcovado NP, Costa Rica – hand for scale. Photo Credit: E. Grason – that’s right, I went to Costa Rica and it was totally amazingOMG!

No more feeling guilty about spending time on Facebook while eating your lunch at your desk! No more casually closing your laptop when your advisor walks by tryna act like you were just finishing the conclusions of your thesis! No more hiding in the Instagram closet – I welcome you to the 21st century where all of the world’s problems are solved (if not also caused) by social media!

Vijay Barve recently provided me with all of the ammunition I need to justify the the time I already waste online in a recent Ecological Informatics paper. He advocates for the utility of social networking sites in the landscape of Digital Accessible Knowledge. That is: scientists should take advantage of all the hobbyist wildlife photographers out there who post on Flickr, Facebook, Picasa (and LOLcats?). Increasingly, photos are tagged with metadata such as time stamps and are geo-referenced with the location, facilitating inference on changes in species occurence over time and space.

This is, of course, all part of the big data push in biodiversity, and we have discussed other avenues for increasing the quantity of biodiversity data on this blog previously: including making museum collections “available” online (that is, making the data about specimens available, see our Diverse Introspectives conversations with Sharlene Santana), and training an army of volunteers to go be our scientific eyes and ears (The potential of citizen science). Eavesdropping on the online bragging about who saw what on which amazing vacation to Iceland/Bolivia/Antarctica/The Maldives(1) seems like a logical next step.

Barve uses to case studies to compare the quantity and quality of data to another currently-available online data repository, the Global Biodiversity Information Facility (GBIF). Species occurrence data for both the Monarch Butterfly (Danaus plexippus), and the snowy owl (Bubo scandiacus – (2)) were extracted from Flickr as well as GBIF, to explore geographic distribution of the two organisms.

For the Monarch (Figure 1), GBIF and Flickr yielded similar numbers of geo-referenced records/photos, depending on whether the common or scientific name was used as the search term (3). However, for the Snowy Owl (Figure 2), GBIF outperformed Flickr by an order of magnitude. This presumes, I think correctly, that the records are really only useful if they can tell us something about distribution or location of the observation. The author also points out a number of errors in the Flickr data, either misidentifications, or tangential references (as when a user names the Monarch for comparison with whatever the picture is actually of), but doesn’t quantify how much this would reduce the total number of valid observations.

Barve Monarch Fig

Figure 1. Figure 2 from Barve 2014 showing records of Monarch from GBIF (grey circles) and Flickr (+: searches for the common name; o: searches for the genus and species name;-)

In the case of the Snowy Owl, it’s likely that some of the pictures were taken at zoos. However, both examples also show several cases where the data from Flickr exceed the spatial extent of the data from GBIF, and might actually improve our knowledge of the distribution of the animals, such as central Europe for the Monarch, and southern Europe for the owl. It’s also apparent from these figures that scientists go many places that tourists are not as eager to spend time, like Nunavut.

Barve Bubo fig

Figure 2. Figure 3 from Barve. Distribution of observations of Snowy Owl from Flickr and GBIF. Symbols as for Figure 1.

So it’s clear to me that there is potential here, but there is still a long way to go in making this a usable technology. If I were a cynic, I might argue that the data monkey on Ecology’s back has finally driven us to rock bottom, and we are so thirsty for data that we will find a way to subsist off of literally the lowest grade of information. If we consider biodiversity data on a scale that represents the trade-off between quantity and quality, E.O. Wilson would be on one end, on his knees staring at ants through a magnifying glass, and the guy bragging about how big the bass was he caught via Facebook would be on the other (4).

Some other considerations I think might be relevant:

  • What is the quality of the geographic data on social media sites?  On some sites, the data from the capture device (phone, camera, etc) is used, but on others, you can drop a pin by hand. How good is your memory of exactly where you were in the Amazon?
  • *Cough, cough* Biasedtowardcharismaticmegafauna. Yes, butterflies count as charismatic at least.
  • It’s unclear whether European organisms will invoke the “right to be forgotten” which could impose serious geographic bias on distributions.

I can see, however, that this type of information could be useful for keeping track of rapidly-emerging natural events, such as the irruption of the snowy owl discussed in the paper, or for identifying areas where additional research should be directed. Certainly this mountain of information could be used for something. If nothing else, I almost always enjoy just flipping through the photos and appreciating the diversity for what it is – totally effective clickbait.

  1. How did I not know that there is a Wallace’s Line cruise?! This is now on my bucket list and you will see how amazing it was on my Picasa page.
  2. Bubo is a pretty funny genus name (sorry orthithologists, you probably get this all the time). And while the first thing that popped into my head was Bubotuber juice from Harry Potter, I subsequently realized that a different phonetic association might occur to teenaged boys, but not because they know their Greek. Turns out the etymology of the word Bubo is even more likely to make middle schoolers giggle than I originally suspected since it evidently comes from “swelling of the groin”.
  3. It’s unclear to me how much the list of Flickr occurrences based on a query of the common name overlapped with the list of Flickr photos tagged with the genus and species names.  Presumably some photos had both.
  4. I think a fruitful area of discussion at cocktail parties (j/k, grad student happy hours) might be the area in between.  Here, rank the following in terms of where you think they fall on the quality/quantity of data spectrum:
    • Graduate students
    • Undergrads
    • Faculty
    • Citizen Scientists
    • Private Sector Scientists
    • Parents who help graduate students collect data for their projects
    • Internet Trolls responding to articles about science


December 2, 2014